In-depth Demo
Notebook setup
%reload_ext autoreload
%autoreload 2
%matplotlib inline
import time
import warnings
import os, sys
from copy import deepcopy
from pprint import pprint as print

import matplotlib.pyplot as plt
import numpy as np
from tqdm.auto import tqdm, trange

from multirotor.helpers import DataLog
from multirotor.vehicle import MotorParams, VehicleParams, PropellerParams, SimulationParams, BatteryParams
from multirotor.controller import (
    PosController, VelController,
    AttController, RateController,
    AltController, AltRateController,
    Controller
)
from multirotor.simulation import Multirotor, Propeller, Motor, Battery
from multirotor.coords import body_to_inertial, inertial_to_body, direction_cosine_matrix, euler_to_angular_rate
from multirotor.env import SpeedsMultirotorEnv, DynamicsMultirotorEnv
from multirotor.trajectories import Trajectory, eight_curve
from multirotor.visualize import plot_datalog
# Plotting/display parameters
# https://stackoverflow.com/a/21009774/4591810
float_formatter = "{:.3f}".format
np.set_printoptions(formatter={'float_kind':float_formatter})

SMALL_SIZE = 16
MEDIUM_SIZE = 16
BIGGER_SIZE = 20

plt.rc('font', size=SMALL_SIZE)          # controls default text sizes
plt.rc('axes', titlesize=MEDIUM_SIZE)     # fontsize of the axes title
plt.rc('axes', labelsize=BIGGER_SIZE, titlesize=BIGGER_SIZE)    # fontsize of the x and y labels
plt.rc('xtick', labelsize=MEDIUM_SIZE)    # fontsize of the tick labels
plt.rc('ytick', labelsize=MEDIUM_SIZE)    # fontsize of the tick labels
plt.rc('legend', fontsize=SMALL_SIZE)    # legend fontsize
plt.rc('figure', titlesize=BIGGER_SIZE)  # fontsize of the figure title
Parameters
# Tarot T18 params
bp = BatteryParams(max_voltage=22.2)
mp = MotorParams(
    moment_of_inertia=5e-5,
    # resistance=0.27,
    resistance=0.081,
    k_emf=0.0265,
    # k_motor=0.0932,
    speed_voltage_scaling= 0.0347,
    max_current=38.
)
pp = PropellerParams(
    moment_of_inertia=1.86e-6,
    use_thrust_constant=True,
    k_thrust=9.8419e-05, # 18-inch propeller
    # k_thrust=5.28847e-05, # 15 inch propeller
    k_drag=1.8503e-06, # 18-inch propeller
    # k_drag=1.34545e-06, # 15-inch propeller
    motor=mp
)
vp = VehicleParams(
    propellers=[pp] * 8,
    battery=bp,
    # angles in 45 deg increments, rotated to align with
    # model setup in gazebo sim (not part of this repo)
    angles=np.linspace(0, -2*np.pi, num=8, endpoint=False) + 0.375 * np.pi,
    distances=np.ones(8) * 0.635,
    clockwise=[-1,1,-1,1,-1,1,-1,1],
    mass=10.66,
    inertia_matrix=np.asarray([
        [0.2206, 0, 0],
        [0, 0.2206, 0.],
        [0, 0, 0.4238]
    ])
)
sp = SimulationParams(dt=0.01, g=9.81)
Multirotor
Simulating individual components of the multirotor. These make up the final Multirotor object.
Motor
%matplotlib inline
# Plot motor speeds as a function of time and input voltage signal
plt.figure(figsize=(8,8))
motor = Motor(mp, sp)
for vsignal in [2, 4, 6, 8, 10, 12, 14, 16, 18, 20]:
    speeds = []
    motor.reset()
    speed = vsignal / mp.speed_voltage_scaling
    for i in range(200):
        speeds.append(motor.step(speed))
    plt.plot(speeds, label='%d rad/s' % speed)
plt.legend(ncol=2)
plt.ylabel('Speed rad/s')
plt.xlabel('Time /ms')
Text(0.5, 0, 'Time /ms')

Learning a linear relationship for the equation \(V = k_{scaling} * speed\) for motors. This is useful for SpeedsMultirotorEnv which takes speed signals as the input. This constant converts speeds to applied voltages. The default value inMotorParams is 1, meaning the actions are voltage signals.
from multirotor.helpers import learn_speed_voltage_scaling

def make_motor_fn(params, sp):
    from copy import deepcopy
    params = deepcopy(params)
    params.speed_voltage_scaling = 1.
    def motor_step(signal):
        m = Motor(params, sp)
        for i in range(100):
            s = m.step(signal)
        return s
    return motor_step

print('Voltage = %.5f * speed' % (learn_speed_voltage_scaling(make_motor_fn(mp, sp))))
'Voltage = 0.02862 * speed'
Propeller
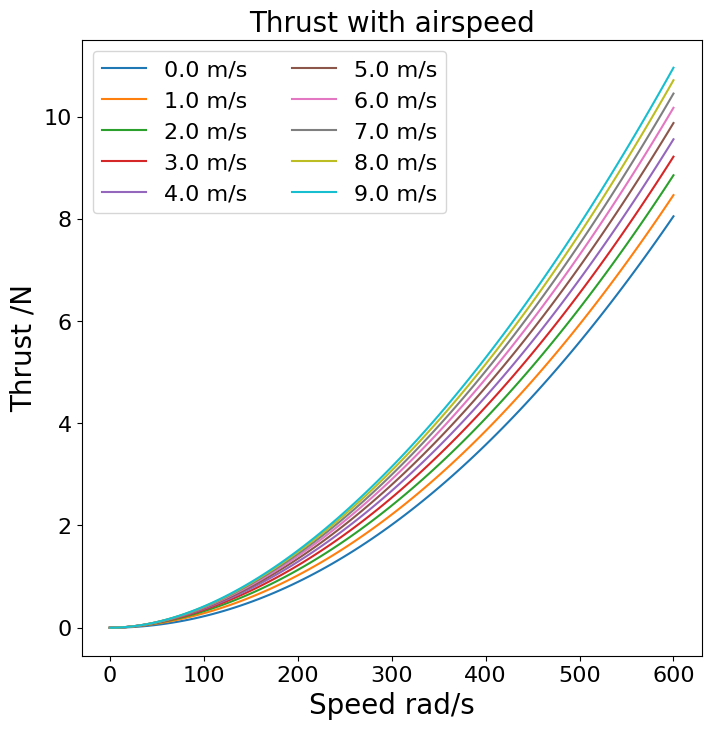
The propeller can use a numerically solved thrust relationship, where thrust depends on airspeed. Or the easier option of using thrust coefficient is available.
%matplotlib inline
# Plot propeller speed by numerically solving the thrust equation,
# *if* accurate propeller measurements are given in params
pp_ = deepcopy(pp)
pp_.use_thrust_constant = False # Set to true to just use k_thrust
prop = Propeller(pp_, sp)
plt.figure(figsize=(8,8))
speeds = np.linspace(0, 600, num=100)
for a in np.linspace(0, 10, 10, endpoint=False):
    thrusts = []
    for s in speeds:
        thrusts.append(prop.thrust(s, np.asarray([0, 0, a])))
    plt.plot(speeds, thrusts, label='%.1f m/s' % a)
plt.xlabel('Speed rad/s')
plt.ylabel('Thrust /N')
plt.title('Thrust with airspeed')
plt.legend(ncol=2)
<matplotlib.legend.Legend at 0x7ff47bce0810>
Vehicle
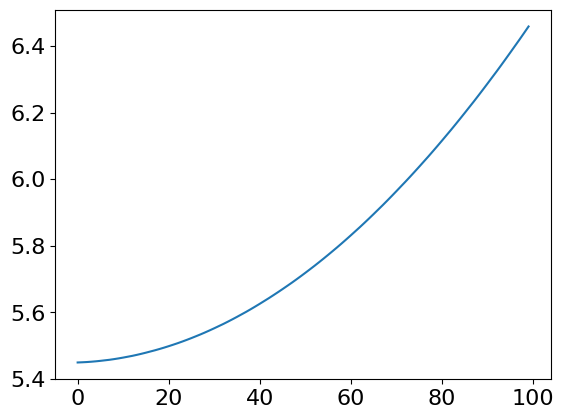
Create a Multirotor object, given VehicleParams and SimulationParams
# Combine propeller/motor/vehicle to get vehicle.
# Take off simulation
m = Multirotor(vp, sp)
log = DataLog(vehicle=m) # convenient logging class
m.reset()
m.state *= 0 # set to zero, reset() sets random values
action = m.allocate_control( # In this case action is allocated speed signals
    thrust=m.weight * 1.1,
    torques=np.asarray([0, 0, 0])
)
for i in range(500):
    m.step_speeds(action)
    log.log()
log.done_logging()
plt.plot(log.z)
[<matplotlib.lines.Line2D at 0x7ff47bf15a50>]

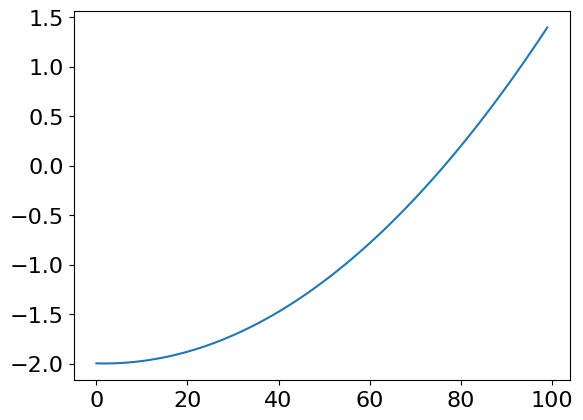
Gym Environment
# this env takes the vector of [force_x, force_y, force_z, torque_x, torque_y, torque_z] to move
# the multirotor
env = DynamicsMultirotorEnv(Multirotor(vp, sp), max_rads=600)
env.reset()
log = DataLog(vehicle=env.vehicle)
for _ in range(100):
    env.step(np.asarray([0,0,env.vehicle.weight * 1.2, 0,0,0]))
    log.log()
log.done_logging()
plt.plot(log.z)
[<matplotlib.lines.Line2D at 0x7ff47bf03e90>]
# this env takes the vector of speed signals to move
# the multirotor
env = SpeedsMultirotorEnv(Multirotor(vp, sp))
env.reset()
log = DataLog(vehicle=env.vehicle)
for _ in range(100):
    env.step(np.ones(8) * 400)
    log.log()
log.done_logging()
plt.plot(log.z)
[<matplotlib.lines.Line2D at 0x7ff47bfacb90>]
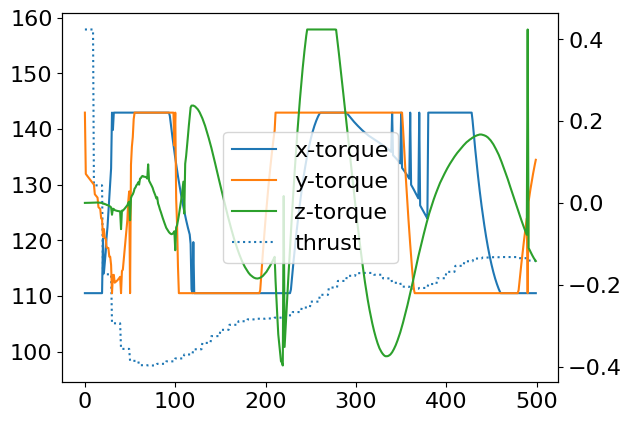
PID Controller
This section explains how a PID controller is constructed. This is a cascaded PID architecture. See Controller docs
for more details.
# From PID parameters file
def get_controller(m: Multirotor, max_velocity=5., max_acceleration=3.):
    assert m.simulation.dt <= 0.1, 'Simulation time step too large.'
    pos = PosController(
        1.0, 0., 0., 1., vehicle=m,
        max_velocity=max_velocity, max_acceleration=max_acceleration,
        square_root_scaling=False, leashing=False
    )
    vel = VelController(
        2.0, 1.0, 0.5,
        max_err_i=max_acceleration,
        max_tilt=np.pi/12,
        vehicle=m)
    att = AttController(
        [2.6875, 4.5, 4.5],
        0, 0.,
        max_err_i=1.,
        vehicle=m)
    rat = RateController(
        [4., 4., 4.],
        0, 0,
        max_err_i=0.5,
        max_acceleration=1.,
        vehicle=m)
    alt = AltController(
        1, 0, 0,
        max_err_i=1, vehicle=m,
        max_velocity=max_velocity)
    alt_rate = AltRateController(
        5, 0, 0,
        max_err_i=1, vehicle=m)
    ctrl = Controller(
        pos, vel, att, rat, alt, alt_rate,
        period_p=0.1, period_a=0.01, period_z=0.1
    )
    return ctrl
%matplotlib inline
m = Multirotor(vp, sp)
ctrl = get_controller(m)
log = DataLog(vehicle=m, controller=ctrl)
for i in range(500):
    action = ctrl.step((0.01,0.1,1,0))
    # no allocation or motor simulation, for which we first need to
    # m.step_speeds(m.allocate_control(action[0], action[3:])
    # Instead, requested dynamics are fulfilled:
    dynamics = np.zeros(6, m.dtype)
    dynamics[2] = action[0]
    dynamics[3:] = action[1:]
    m.step_dynamics(dynamics)
    log.log()
log.done_logging()

plt.plot(log.actions[:,0], ls=':', label='thrust')
lines = plt.gca().lines
plt.twinx()
for s, axis in zip(log.actions.T[1:], ('x','y','z')):
    plt.plot(s, label=axis + '-torque')
plt.legend(handles=plt.gca().lines + lines)
<matplotlib.legend.Legend at 0x7ff47b614f10>
Attitude Angle Controller
m = Multirotor(vp, sp)
fz = m.weight
ctrl = get_controller(m)
att =  ctrl.ctrl_a
log = DataLog(vehicle=m, controller=ctrl, other_vars=('err',))
for i in range(5000):
    ref = np.asarray([np.pi/18, 0, 0])
    # action is prescribed euler rate
    action = att.step(ref, m.orientation, dt=sp.dt)
    # action = np.clip(action, a_min=-0.1, a_max=0.1)
    m.step_dynamics(np.asarray([0, 0, 0, *action]))
    log.log(err=att.err_p[0])
    log._actions[-1] = action
log.done_logging()

plt.plot(log.roll * 180 / np.pi)
plt.twinx()
plt.plot(log.actions[:,0], ls=':', label='Rate rad/s')
[<matplotlib.lines.Line2D at 0x7ff47b2653d0>]

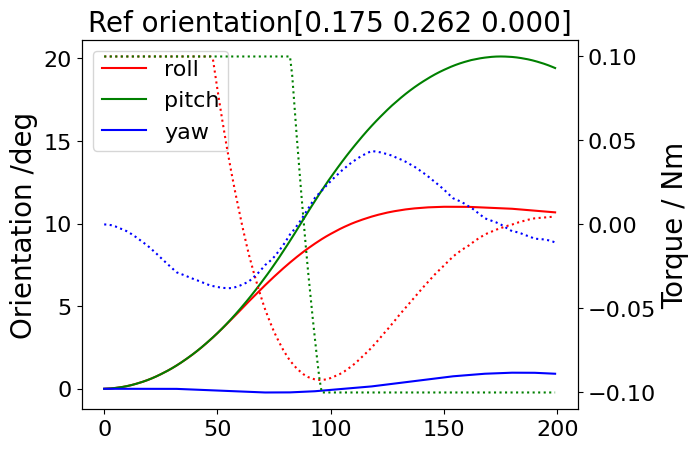
Attitude Rate Controller
m = Multirotor(vp, sp)
fz = m.weight
ctrl = get_controller(m)
rat = ctrl.ctrl_r
att = ctrl.ctrl_a
log = DataLog(vehicle=m, controller=ctrl, other_vars=('err',))
for i in range(200):
    ref = np.asarray([np.pi/18, np.pi/12, 0])
    rate = att.step(ref, m.orientation, m.simulation.dt)
    torque = rat.step(rate, m.euler_rate, m.simulation.dt)
    action = np.clip(torque, a_min=-0.1, a_max=0.1)
    m.step_dynamics(np.asarray([0, 0, 0, *action]))
    log.log(err=rat.err_p[0])
    log._actions[-1] = action
log.done_logging()

plt.plot(log.roll * 180 / np.pi, c='r', label='roll')
plt.plot(log.pitch * 180 / np.pi, c='g', label='pitch')
plt.plot(log.yaw * 180 / np.pi, c='b', label='yaw')
plt.ylabel('Orientation /deg')
plt.legend()
plt.twinx()
plt.plot(log.actions[:,0], ls=':', c='r')
plt.plot(log.actions[:,1], ls=':', c='g')
plt.plot(log.actions[:,2], ls=':', c='b')
plt.ylabel('Torque / Nm')
plt.title('Ref orientation' + str(ref))
Text(0.5, 1.0, 'Ref orientation[0.175 0.262 0.000]')
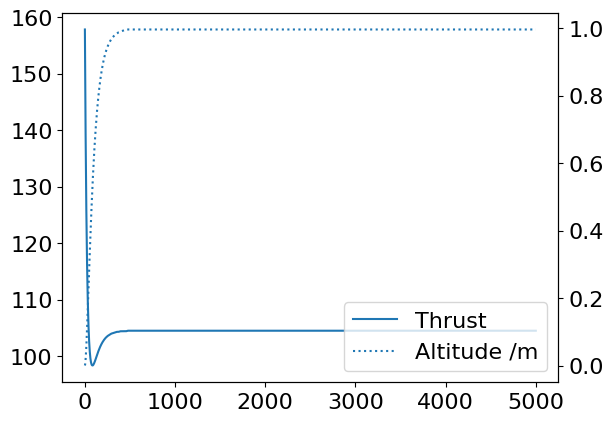
Altitude Controller
m = Multirotor(vp, sp)
ctrl = get_controller(m)
alt = ctrl.ctrl_z
alt_rate = ctrl.ctrl_vz
log = DataLog(vehicle=m, other_vars=('thrust',))
for i in range(5000):
    ref = np.asarray([1.])
    rate = alt.step(ref, m.position[2:], dt=0.1)
    action = alt_rate.step(rate, m.inertial_velocity[2:], dt=0.1)
    action = np.clip(action, a_min=-2*m.weight, a_max=2*m.weight)
    m.step_dynamics(np.asarray([0, 0, action[0], 0,0,0]))
    log.log(thrust=action)
    #log._actions[-1] = action
log.done_logging()

l = plt.plot(log.thrust.squeeze(), label='Thrust')
plt.twinx()
plt.plot(log.z, ls=':', label='Altitude /m')
plt.legend(handles=l+plt.gca().lines)
<matplotlib.legend.Legend at 0x7ff47b4881d0>
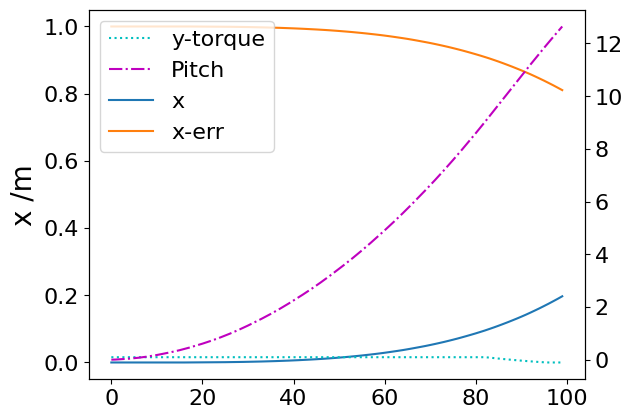
Position Controller
m = Multirotor(vp, sp)
ctrl = get_controller(m)
pos = ctrl.ctrl_p
vel = ctrl.ctrl_v
rat = ctrl.ctrl_r
att = ctrl.ctrl_a
log = DataLog(vehicle=m, other_vars=('err', 'torques'))
for i in range(100):
    ref = np.asarray([1.,0.])

    # converting position -> velocity -> angles
    velocity = pos.step(ref, m.position[:2], dt=0.1)
    angles = vel.step(velocity, m.velocity[:2], dt=0.1)[::-1]
    # attitude controller operates at higher frequency
    rate = att.step(np.asarray([*angles, 0]), m.orientation, dt=0.01)
    action = rat.step(rate, m.euler_rate, dt=0.01)
    # clipping torques to prevent over-reactions
    action = np.clip(action, a_min=-0.1, a_max=0.1)
    m.step_dynamics(np.asarray([0, 0, m.weight, *action]))
    log.log(err=pos.err[0], torques=action)
log.done_logging()

plt.plot(log.x, label='x')
plt.plot(log.err, label='x-err')
plt.ylabel('x /m')
l = plt.gca().lines
plt.twinx()
plt.plot(log.torques[:,1], ls=':', label='y-torque', c='c')
plt.plot(log.pitch * 180 / np.pi, ls='-.', label='Pitch', c='m')
plt.legend(handles=plt.gca().lines+l)
# plt.plot(log.actions[:,0] * 180 / np.pi, ls=':')
<matplotlib.legend.Legend at 0x7ff47bb86410>
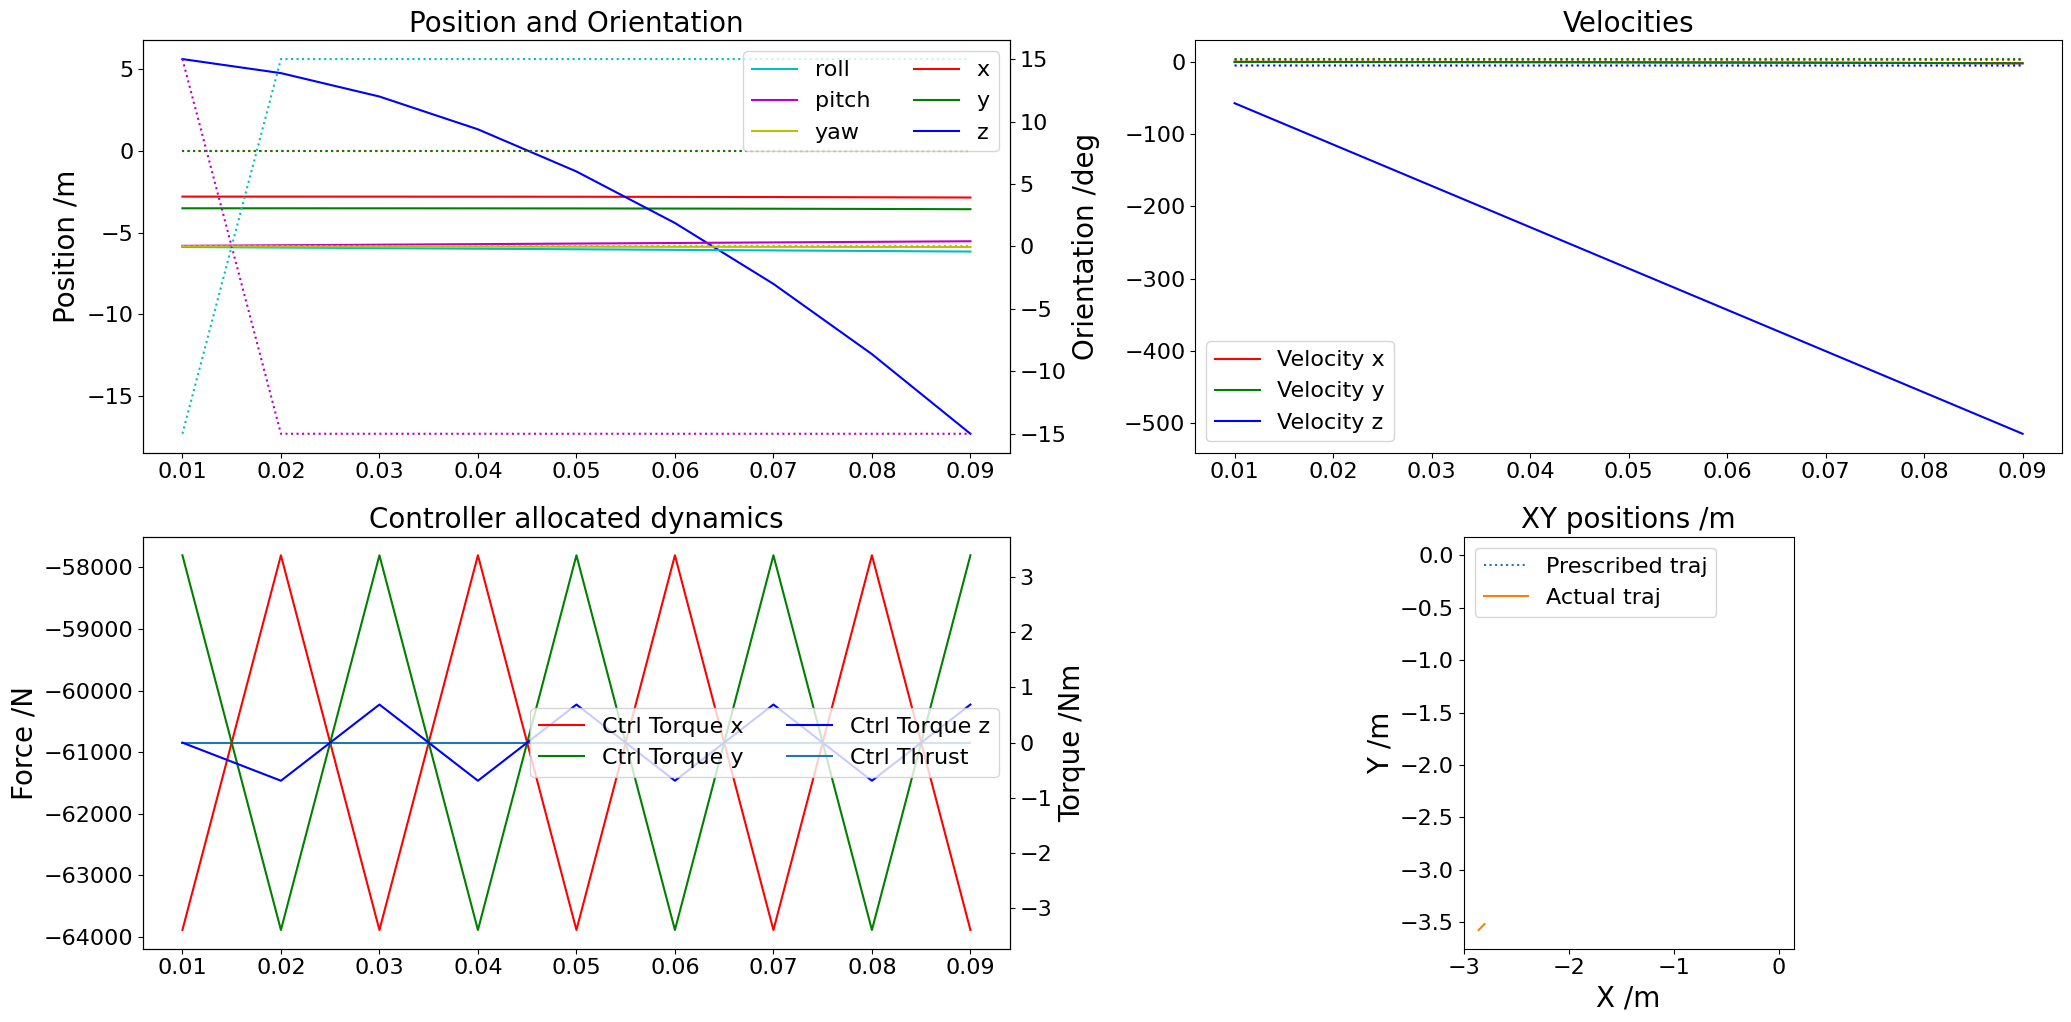
Parameter search
Using optuna to search over the space of PID controller parameters.
from multirotor.optimize import optimize, DEFAULTS
print(DEFAULTS)
Namespace(bounding_box=20, max_velocity=5, max_acceleration=2.5, max_tilt=0.2617993877991494, leashing=True, sqrt_scaling=True, use_yaw=True, num_sims=10, scurve=False, max_err_i_attitude=0.1, max_err_i_rate=0.1)
# search over parameter space. Usually ~500 trials are good. The trials are kept low
# so this notebook builds faster.
study = optimize(vp, sp, ntrials=20)
# apply best parameters from study to controller, and run a simulation
from multirotor.optimize import run_sim, apply_params

env = DynamicsMultirotorEnv(Multirotor(vp, sp))
traj = Trajectory(env.vehicle, [[0,0,0]], proximity=1)
ctrl = get_controller(env.vehicle)
ctrl.set_params(**apply_params(None, params=study.best_params))

env.reset()
ctrl.reset()
log = run_sim(env, traj, ctrl)
plot_datalog(log)
{'pos': <Axes: title={'center': 'Position and Orientation'}, ylabel='Orientation /deg'>,
 'vel': <Axes: title={'center': 'Velocities'}>,
 'ctrl': <Axes: ylabel='Torque /Nm'>,
 'traj': <Axes: title={'center': 'XY positions /m'}, xlabel='X /m', ylabel='Y /m'>}
Simulation
Combining Multiotor and Controller to run a simulation. First, defining waypoints:
from multirotor.trajectories import eight_curve
wp = eight_curve()
Then, defining a disturbance (for example, wind). The disturabance function takes time, Multirotor, and returns the forces in the body frame of the vehicle.
def wind(t: float, m: Multirotor):
    w_inertial = np.asarray([5 * np.sin(t * 2 * np.pi / 4000), 0, 0])
    dcm = direction_cosine_matrix(*m.orientation)
    return inertial_to_body(w_inertial, dcm)
# Defining the run simulation function which illustrates all the
# steps that go into each step of the simulation.
#
def run_simulation(env, traj, ctrl, steps=60_000, disturbance=None):

    log = DataLog(env.vehicle, ctrl,
                  other_vars=('currents', 'voltages'))
    disturb_force, disturb_torque = 0., 0
    for i, (pos, feed_forward_vel) in tqdm(
        enumerate(traj), leave=False, total=steps
    ):
        if i==steps: break
        # Generate reference for controller
        ref = np.asarray([*pos, 0.])
        # Get prescribed dynamics for system as thrust and torques
        dynamics = ctrl.step(ref, feed_forward_velocity=feed_forward_vel)
        thrust, torques = dynamics[0], dynamics[1:]
        # Allocate control: Convert dynamics into motor rad/s
        action = env.vehicle.allocate_control(thrust, torques)
        # get any disturbances
        if disturbance is not None:
            disturb_force, disturb_torque = disturbance(i, env.vehicle)
        # Send speeds to environment
        state, *_ = env.step(
            action, disturb_forces=disturb_force, disturb_torques=disturb_torque
        )
        alloc_errs = np.asarray([thrust, *torques]) - env.vehicle.alloc @ action**2

        log.log(currents=[p.motor.current for p in env.vehicle.propellers],
                voltages=[p.motor.voltage for p in env.vehicle.propellers])

        if np.any(np.abs(env.vehicle.orientation[:2]) > np.pi/6): break

    log.done_logging()
    return log
env = SpeedsMultirotorEnv(vehicle=Multirotor(vp, sp)) # step() takes speed signals
traj = Trajectory(env.vehicle, wp, proximity=2, resolution=10)
ctrl = get_controller(env.vehicle, max_velocity=3.)
env.reset()
ctrl.reset()
log = run_simulation(env, traj, ctrl, steps=10_000, disturbance=None)
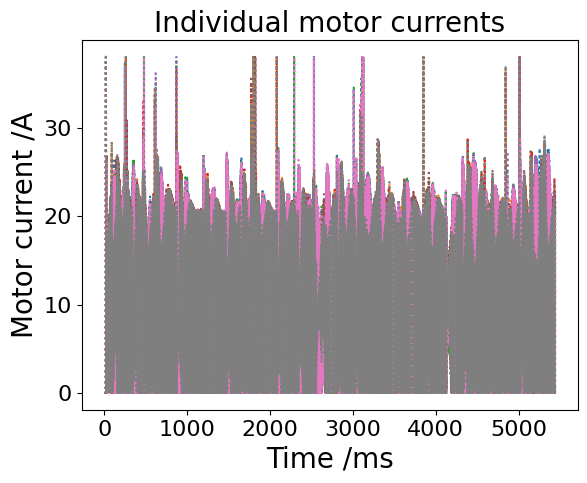
# Currents
plt.plot(log.currents, ls=':')
plt.ylabel('Motor current /A')
plt.xlabel('Time /ms')
plt.title('Individual motor currents')
Text(0.5, 1.0, 'Individual motor currents')
# Voltages
plt.plot(log.voltages, ls=':')
plt.ylim(0, 30)
plt.ylabel('Motor voltage /A')
plt.xlabel('Time /ms')
plt.title('Voltages')
Text(0.5, 1.0, 'Voltages')

# PLot positions, velocities, prescribed dynamics
plot_datalog(log)
{'pos': <Axes: title={'center': 'Position and Orientation'}, ylabel='Orientation /deg'>,
 'vel': <Axes: title={'center': 'Velocities'}>,
 'ctrl': <Axes: ylabel='Torque /Nm'>,
 'traj': <Axes: title={'center': 'XY positions /m'}, xlabel='X /m', ylabel='Y /m'>}

# 3D plot of trajectory
%matplotlib notebook
fig = plt.figure()
xlim = ylim = zlim = (np.min(log.position), np.max(log.position))
ax = fig.add_subplot(projection='3d', xlim=xlim, ylim=ylim, zlim=zlim)
ax.set_xlabel('x')
ax.set_ylabel('y')
ax.set_zlabel('z')
ax.plot(log.x, log.y, log.z)
[<mpl_toolkits.mplot3d.art3d.Line3D at 0x7ff4773255d0>]
